Stereoscope is a web-based prototype for visualizing two core processes of literary studies - hermeneutic exploration of textual meaning and construction of arguments about texts. In Stereoscope scholars can represent their manually created digital annotations with multiple visualizations to record and convey qualitative statements. Different visual representations of annotation data allow multiple perspectives which, in combination with comments and tags, provide the means to craft scholarly arguments about literary works and make them transparent to readers.
Scholarly activities like annotation, comparison and representation form an essential part of interpretative processes in literary studies. Many digital tools incorporate these activities, but do not allow for interpretative and particularly hermeneutic processes to happen in the digital realm. Why is that?
In our research we argue that digital literary studies so far have been agnostic of the premises of hermeneutic theory and that in order to enable hermeneutic processes in digital tools, we need to develop tools that respect these premises. Here, data visualization can adopt a key role in that it supports interpretative activities and creates new perspectives beyond the traditional, text based hermeneutic practices.
A core outcome of our research was the formulation of four functional postulates which visualization tools should aim to put into practice. These postulates constitute guidelines; they are described and discussed in our article Towards Hermeneutic Visualization in Digital Literary Studies (under review; submitted for publication at Digital Humanities Quarterly) in October 2018. Stereoscope is an exemplary prototype implemented in accordance with these guidelines.
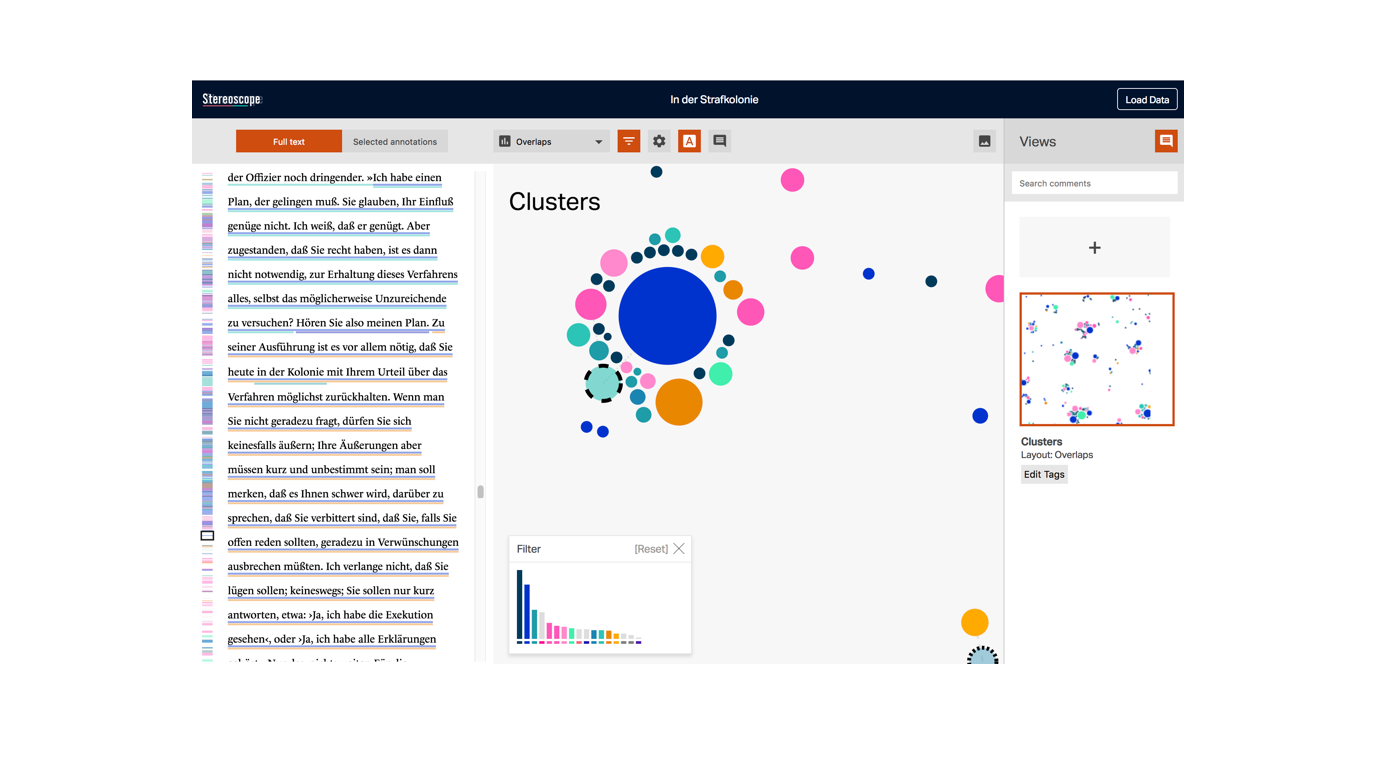
Stereoscope’s interface has three parts. While the left column holds an annotated text, the object of study, the canvas in the centre represents the annotations of the text with different visualization layouts for users to choose from. Annotations in the text on the left and their representations as circles on the canvas in the centre are tightly coupled and change their appearance in both parts when changed in the text or on the canvas. Qualitative attributes of annotations can be altered and recorded by manipulating the visual form.
The right column is used to create and manage different canvas views with particular visualizations, zoom states and manipulations of the annotations. By assigning comments and tags to views argumentations can thus be visually constructed and conveyed.
Would you like to try Stereoscope with your own annotation data? Our (freely available) textual analysis platform CATMA enables you to annotate texts and export annotations as a JSON file. Together with the corresponding text file this JSON file can then be imported into Stereoscope. However, since this is an experimental feature, we need to unlock this functionality in CATMA for you personally. Please contact catma-support@catma.de and send us your request to unlock the json export feature.
Interactive data visualization has its origins in the (empirical) sciences context. Only recently its application has been extended to digital literary studies (and to the digital humanities in general).¹ However, there has been increasing skepticism regarding the appropriateness of common data visualization for representing scholarly work in the humanities. In her article Humanities Approaches to Graphical Display² Drucker criticizes the uncritical use of data visualizations for visualizing interpretative activity and points out the different epistemological foundations in science and the humanities. Data visualizations are shaped by an idea of »observer-independent« data, understood as »mere descriptions of a priori conditions«. In the humanities, on the other hand, knowledge production is based on »constructivist principles«, as she argues, »humanistic inquiry acknowledges the situated, partial and constitutive character of knowledge production«.
In the 3DH research project we set out to investigate what visualizations that respect these premises of interpretative activity might look like. Focusing on hermeneutics as the oldest theory of interpretation we developed guidelines for designing hermeneutic visualizations that are based on premises of hermeneutic theory. Stereoscope serves as an exemplary implementation of hermeneutic visualization in accordance with these guidelines.